

INFRARED SPECTROSCOPY IN TEXTILES INVESTIGATIONS
Autor:
Pilleriin Peets, Signe Vahur, Ivo Leito
Year:
Anno 2015
Category:
Research
Throughout history, textiles have been made of various fibres using independent fibres and mixtures. Due to the abundance and similarity of textiles, identifying them is difficult, but an important procedure.
In this article, a short overview of different analytical methods for investigation of textiles is given. ATR-FT-IR (Attenuated Total Reflectance Fourier’ Transform Infrared) spectroscopy and its advantages and limitations for identification of textile fibres have been paid a more detailed attention.
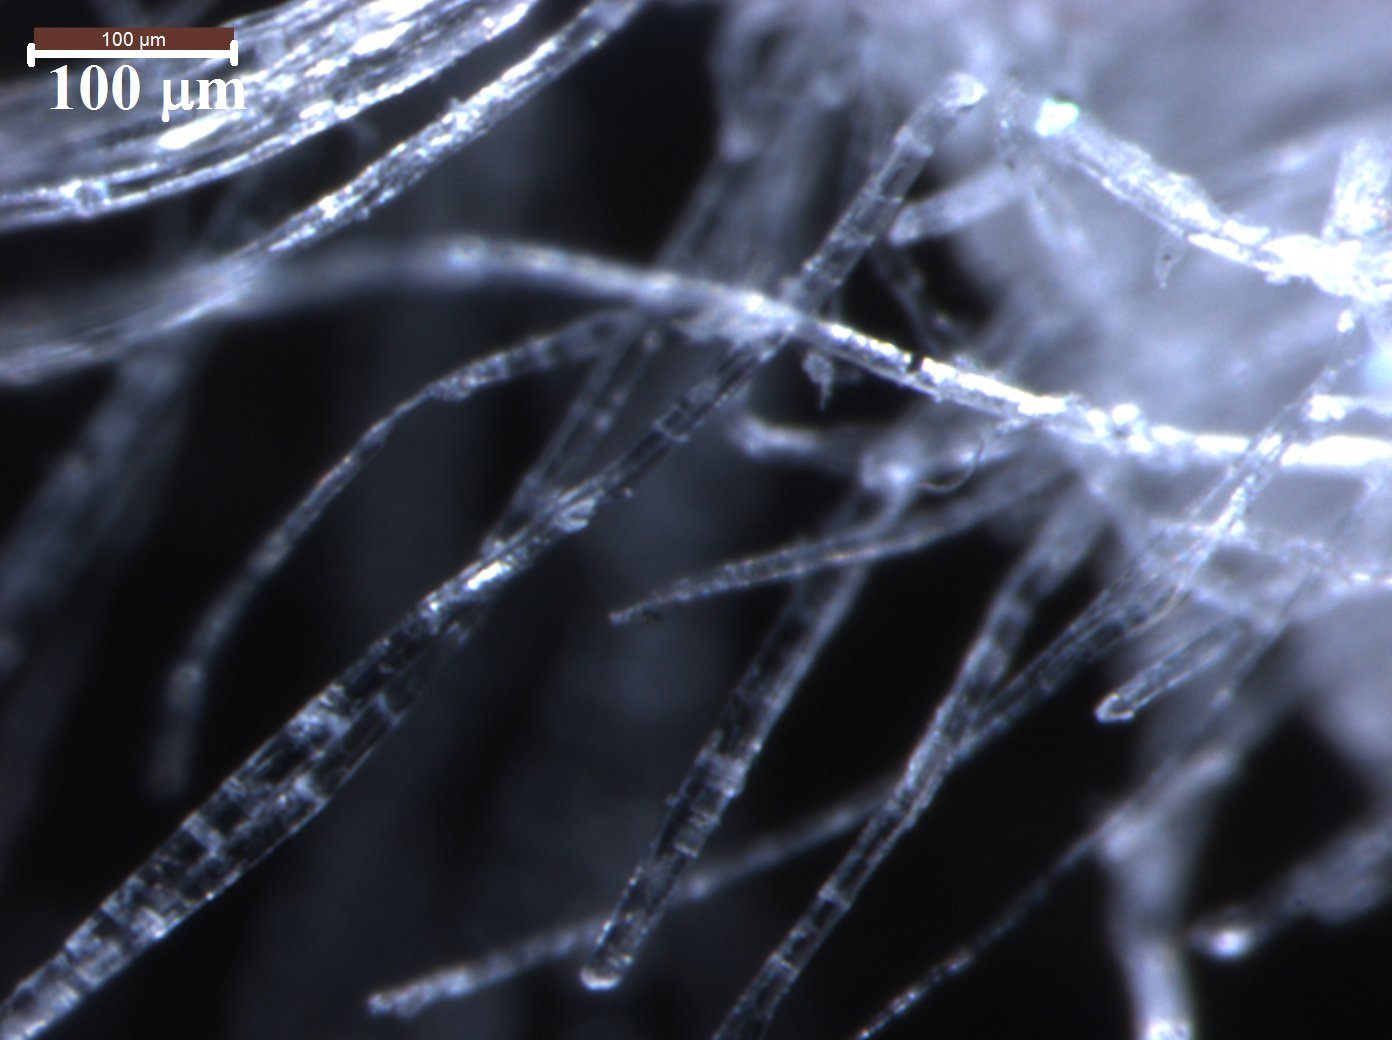
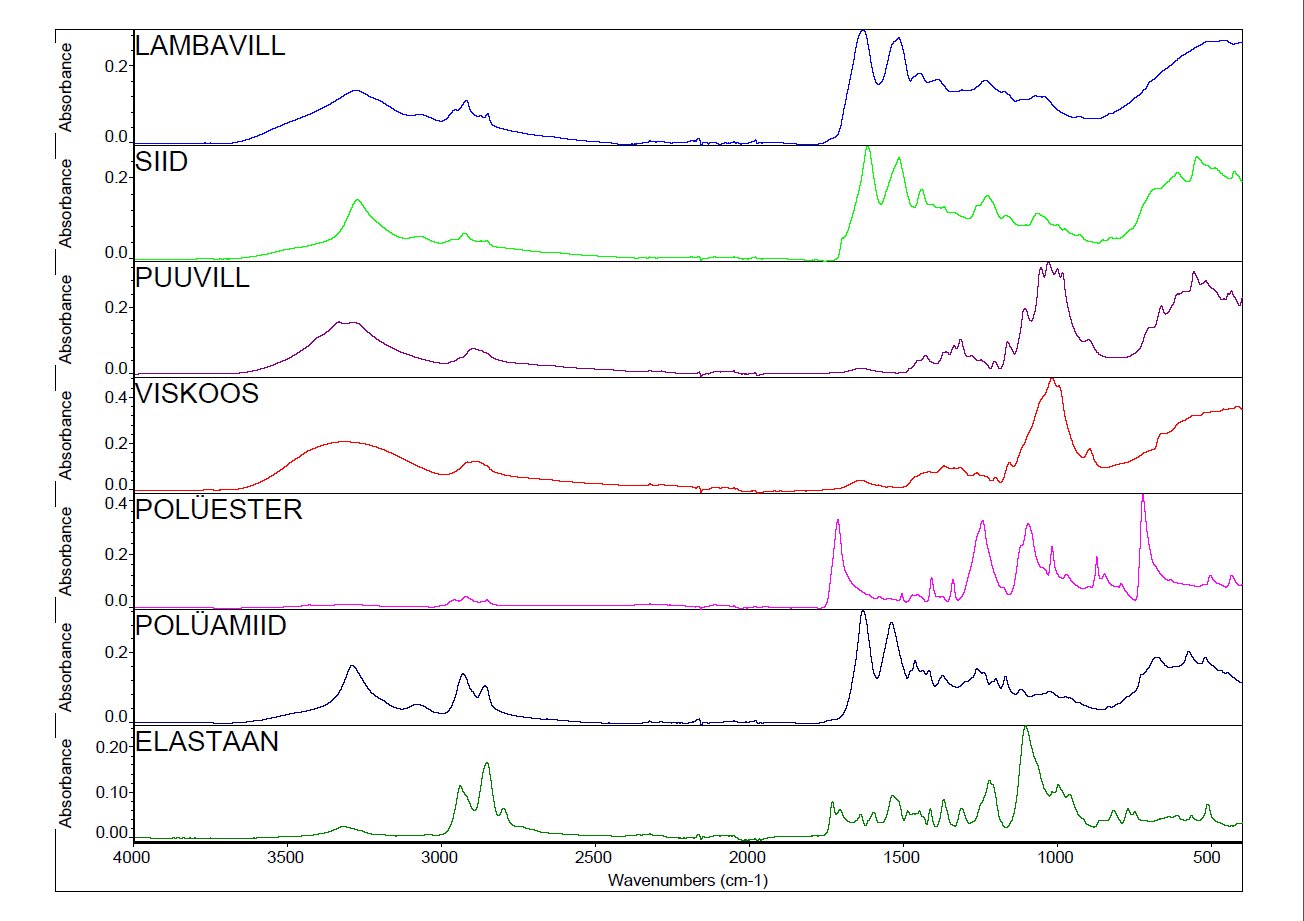
ATR-FT-IR spectroscopic method enables to identify fibres using interpretation of spectra and classification method. Using ATR-FT-IR spectroscopy with optical microscopy, it is possible to distinguish popular natural and artificial fibres. ATR-FT-IR is capable of distinguishing cellulose-based fibres from others, but linen and cotton spectra are almost identical. However, using optical microscopy additionally, it is also possible to distinguish between linen and cotton.
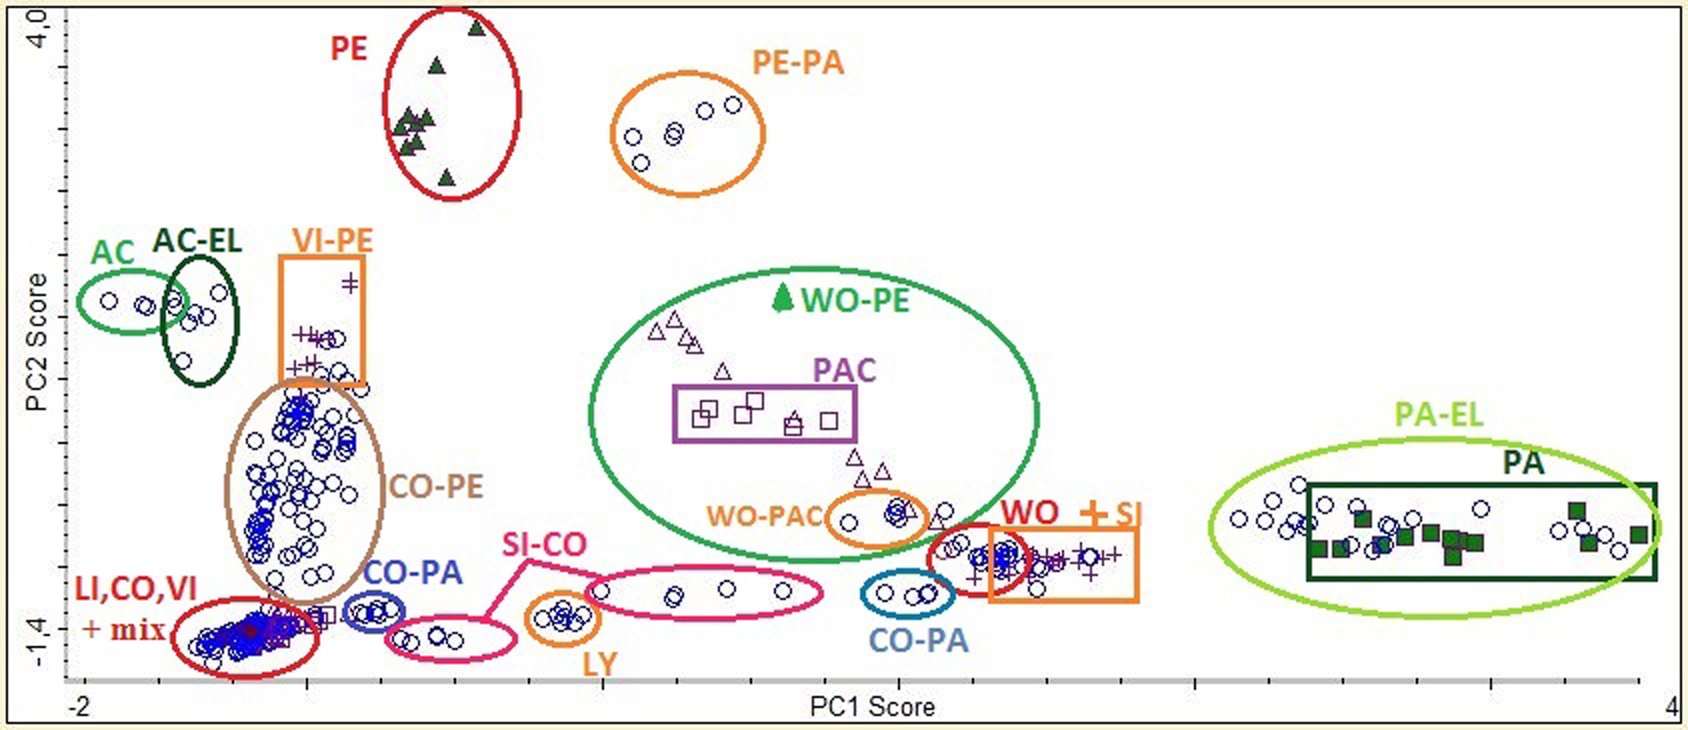
Classification enables quickly and easily to perform identification of pure and mixed fibre samples. Besides that, it is possible to perform semi-quantitative analysis, which enables to determine the approximate content of mixed samples. Classification and semi-quantitative analysis of different fibres were carried out using their ATR-FT-IR spectra and chemometric tools, such as principal component analysis (PCA) and discriminant analysis.
Our research showed that ATR-FT-IR spectroscopy is a fast, easy and non-destructive method for qualitative and semi-quantitative analysis of most common textile fibres.
Table 1. Comparison of different methods for identifying textiles
REFERENCES:
Houck, M. M. Identification of textile fibres. Woodhead Publishing: Cambridge, 2009.
Paris, H. Materjaliõpetus. I raamat. Tallinn: Oskusraamat, 1939.
Boncamper, I. Tekstiilikiud: käsiraamat. Tallinn: Eesti Rõiva- ja Tekstiililiit: Tallinn, 2000.
Peets, H. Lihtsamad analüüsimeetodid; http://www.kanut.ee/index.php/koolitused/102-kutseoskustega-seotud-taeiendkoolitus-2008 Koolituse õppematerjal. Viimati uuendatud 11.11.2008.
Crighton, J. S.; Holmes, D. A. The Application of Thermal Analysis to Textiles. Part I: Identification of Fibre-blend Components by Using Thermogravimetry. Journal of The Textile Institute. 1998, 89:2, 198–207.
Cleve, E.; Bach, E.; Schollmeyer, E. Using chemometric methods and NIR spectrophotometry in the textile industry. – Analytica Chimica Acta. 2000, 420, 163–167.
Lu, W.; Fei, J.; Yang, J.; Tang, M.; Dong, Z.; Zhou, Z.; Ye, J.; Wu, H. A novel method to identify yak fiber in textile. – Textile Research Journal. 2013, 83(8), 773–779.
Paolella, S.; Bencivenni, M.; Lambertini, F.; Prandi, B.; Faccini, A.; Tonetti, C.; Vineis, C.; Sforza, S. Identification and quantification of different species in animal fibres by LC/ESI-MS analysis of keratin-derived proteolytic peptides. – Journal of Mass Spectrom. 2013, 48, 919–926.
Smith, B. Infrared Spectral Interpretation. A Systematic Approach. CRC Press LLC: Boca Raton, 1999.
Kaljurand, M. Kemomeetria. Tallinn: Tallinna Tehnikaülikool, 2008.
Varmuza, K.; Filzmoser, P. Introduction to multivariate statistical analysis in chemometrics. CRC Press: Boca Raton, 2009.
TQ AnalystTM User’s Guide; Thermo Fisher Scientific Inc.: Madison, USA, 2007.